
EPMA objectives
Quantitative elemental composition, WDS spectra, elemental maps, phase comparison, inclusions, and microstructural chemistry.
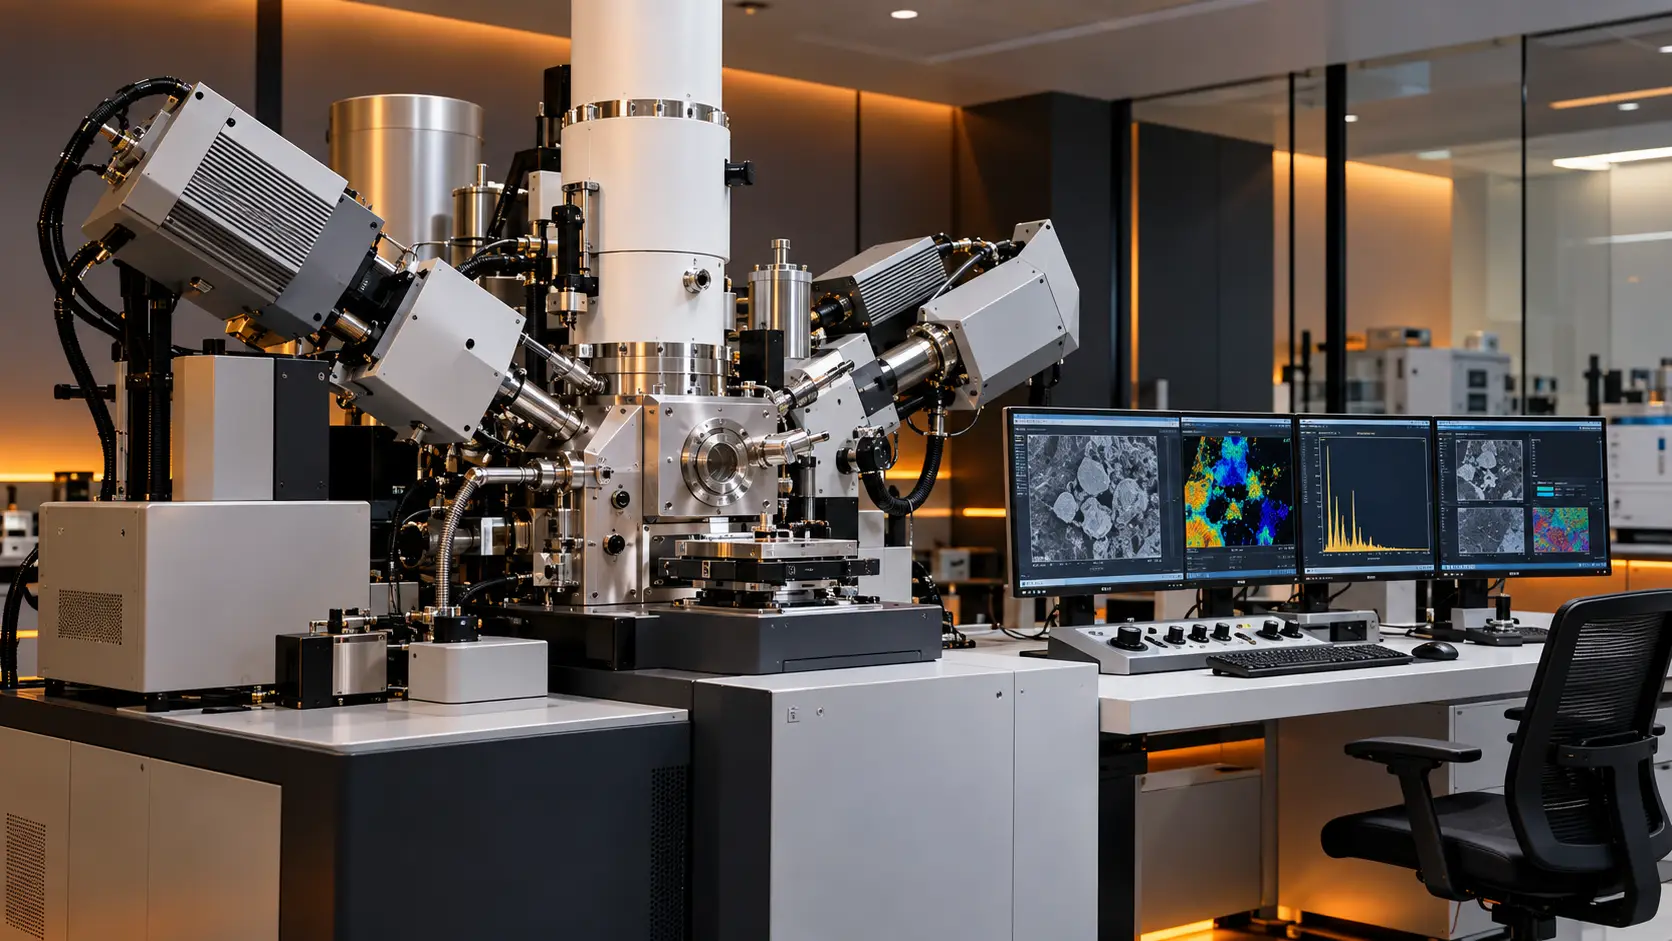
EPMA analysis India uses a focused electron beam to generate characteristic X-rays from a selected micro-volume. Wavelength-dispersive spectrometers can support quantitative elemental composition, while elemental mapping can show how elements are distributed across minerals, alloys, ceramics, geological samples, coatings, and other suitable polished materials.
Quantitative elemental composition, WDS spectra, elemental maps, phase comparison, inclusions, and microstructural chemistry.
Minerals, metals, alloys, ceramics, geological samples, glasses, coatings, and suitable semiconductor materials.
Share the material, polished-surface condition, expected elements, target phase, sample dimensions, and analysis objective.
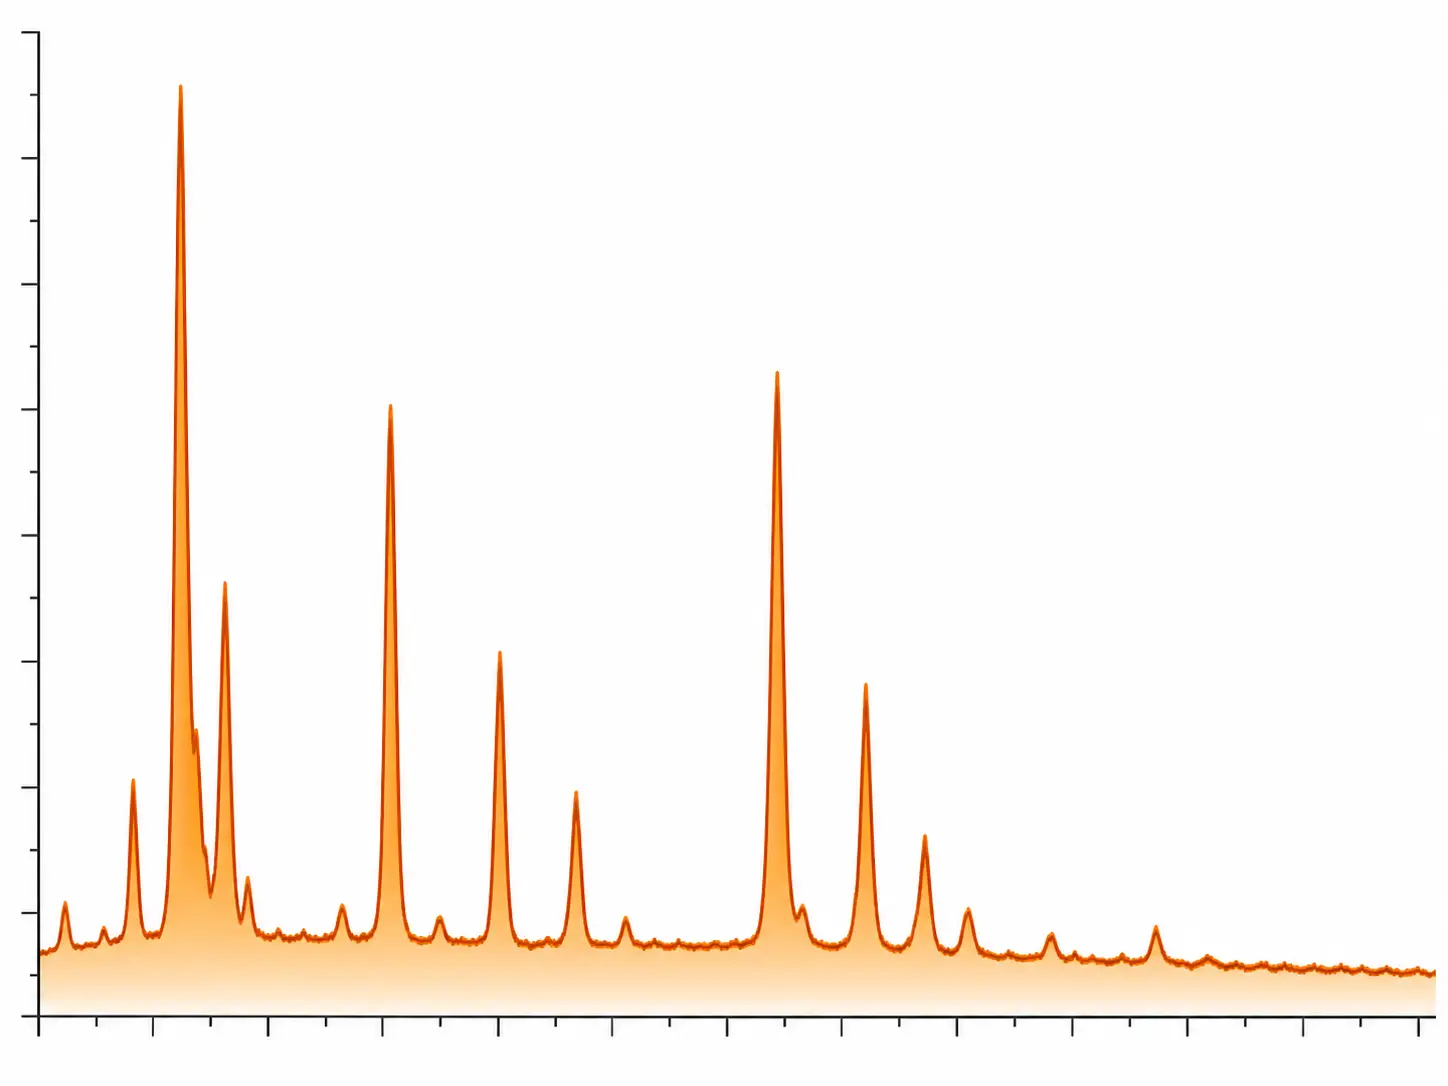
EPMA directs a focused electron beam onto a prepared sample and measures characteristic X-rays generated by electron–sample interactions. Wavelength-dispersive spectrometers separate X-ray energies for elemental identification and quantitative analysis.
Results depend on surface preparation, standards, matrix correction, beam conditions, sample composition, phase geometry, and the elements being investigated.
WDS measurements are performed for selected characteristic X-ray wavelengths, allowing the analysis to focus on specific elemental signals. The usefulness of quantitative results therefore depends on the quality of the prepared surface, suitable standards, the selected analytical conditions, and the material system being examined.
The appropriate EPMA route depends on sample preparation, expected elements, phase size, required detection capability, standards, and whether point analysis or mapping is required.
Measure elemental composition at selected points or phases using suitable standards and matrix corrections.
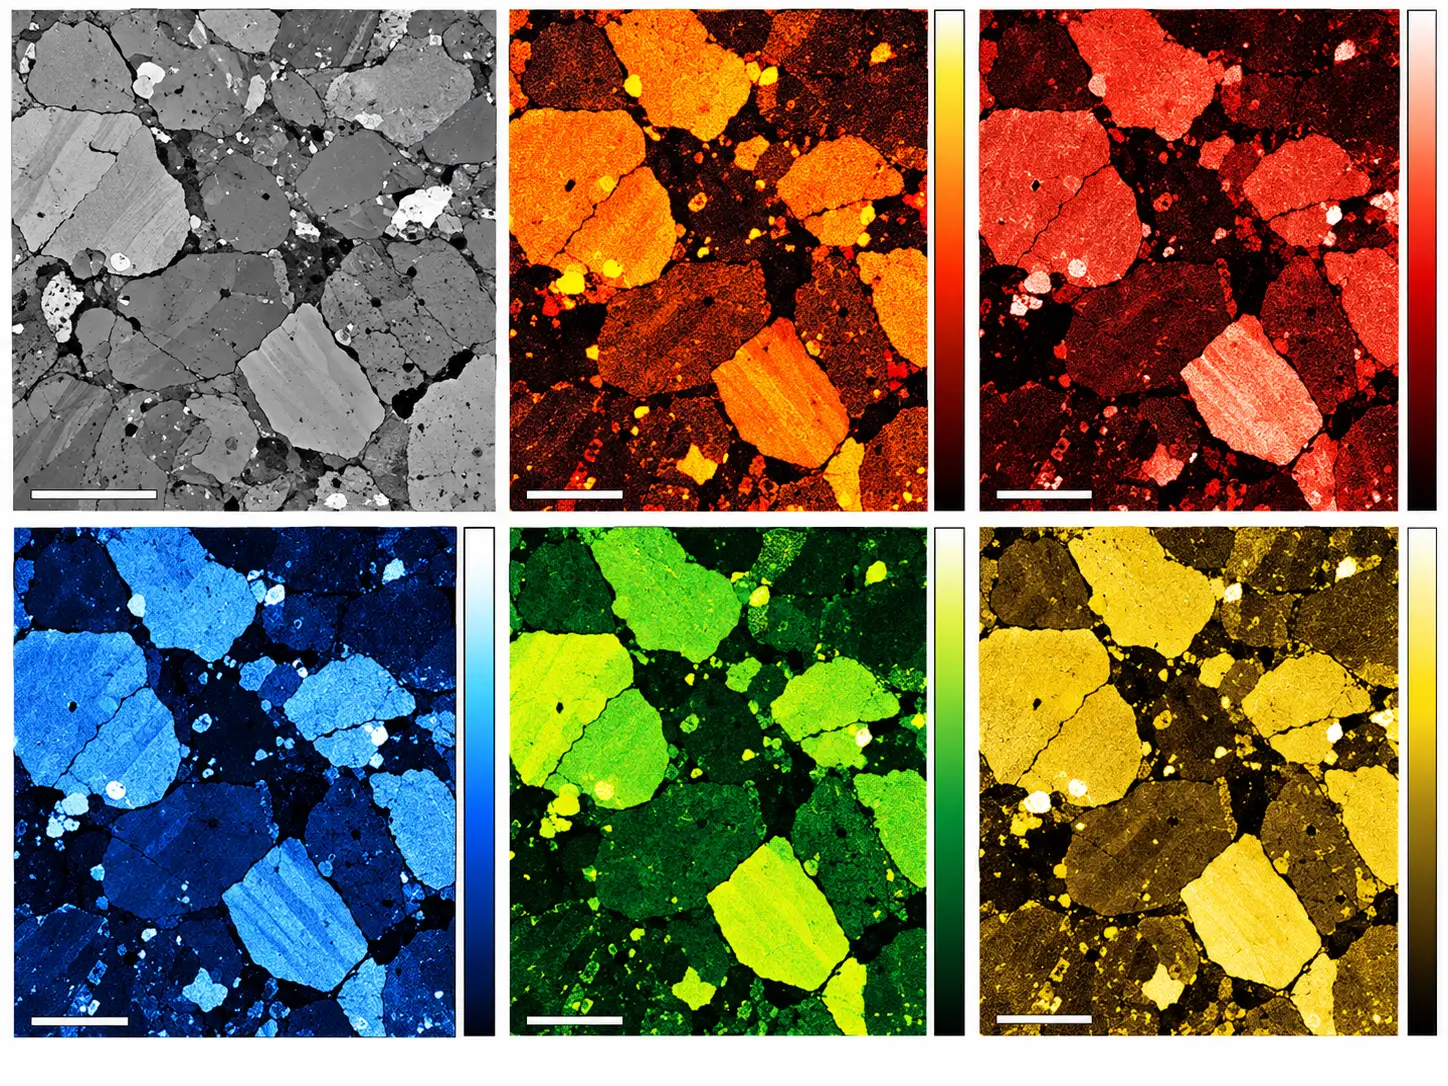
Visualize the spatial distribution of selected elements across grains, phases, inclusions, interfaces, or defects.
Support mineral identification, alloy-phase comparison, ceramic chemistry, geological studies, and microstructural interpretation.
A focused electron beam interacts with a polished sample and generates characteristic X-rays. The emitted X-rays carry information about the elements present in the selected micro-volume.
Wavelength-dispersive spectrometers measure specific X-ray wavelengths, while mapping systems raster the beam to show elemental distribution across a selected area.
Tap a component to see its role in EPMA analysis.
The electron beam excites X-rays from the polished sample, WDS spectrometers separate characteristic wavelengths, and point or mapping data are interpreted for quantitative elemental and phase chemistry.
EPMA can provide composition information from selected points or regions in a polished sample. Quantitative interpretation typically considers standards, matrix effects, beam conditions, phase homogeneity, and the elements of interest.
Elemental maps can complement point analyses by showing how composition varies across grains, phases, inclusions, interfaces, and microstructural features.
Point measurements are useful when the investigation focuses on a defined grain, phase, inclusion, or microstructural region. Mapping is useful when the objective is to understand spatial variation and relationships between composition and sample structure.
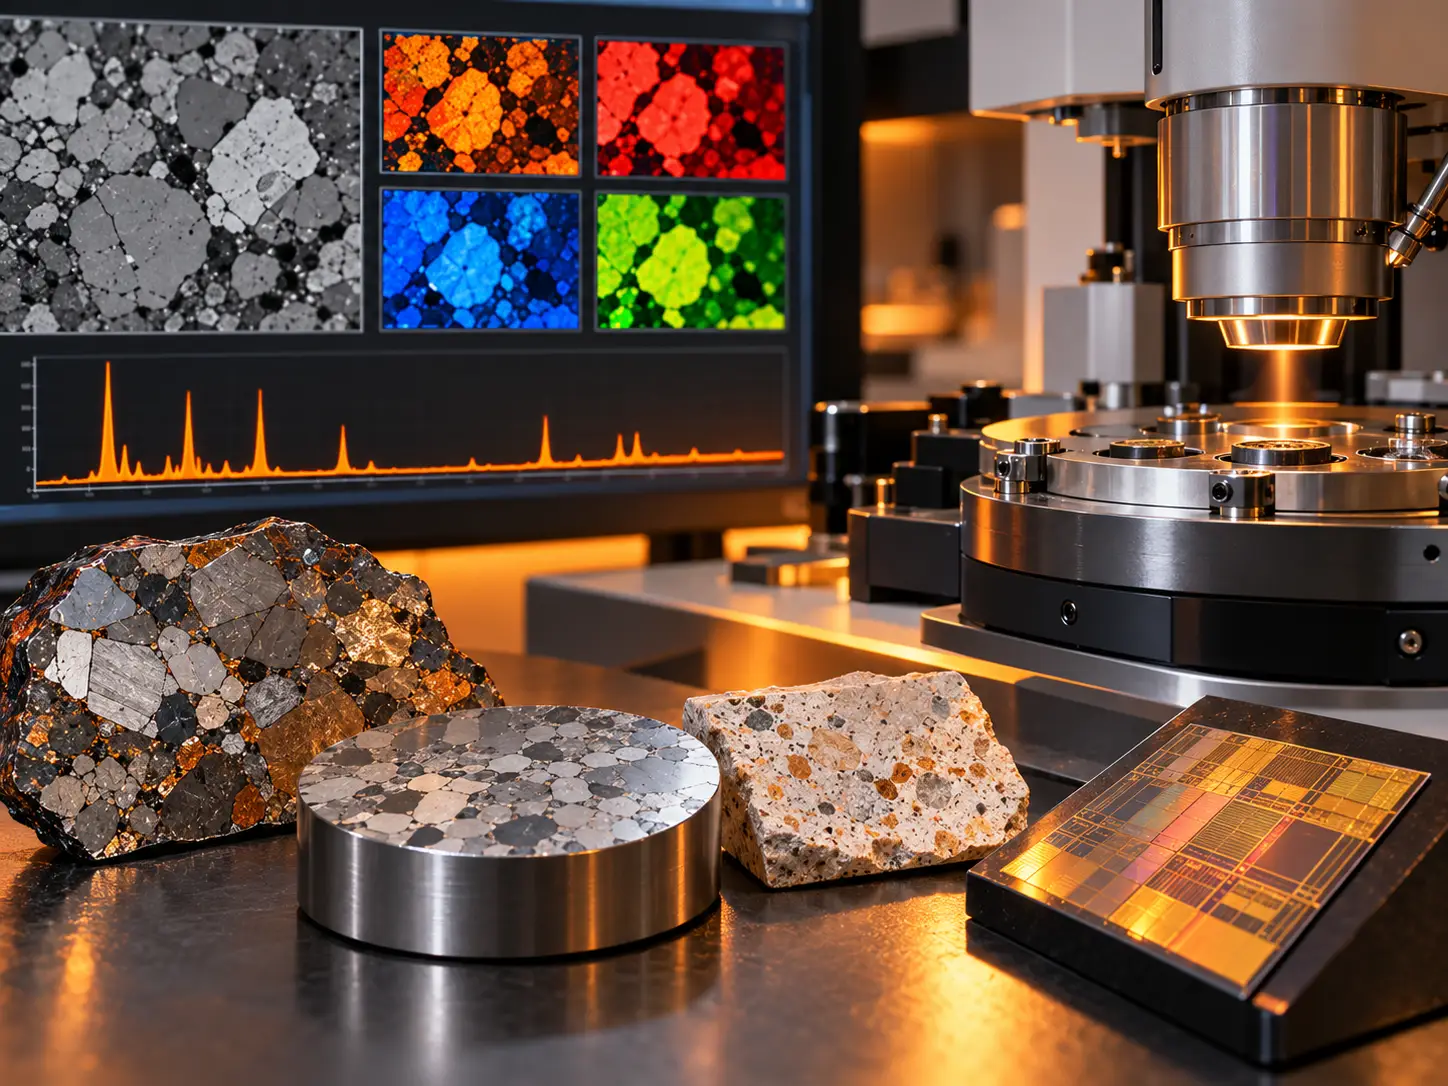
EPMA is used when quantitative micro-volume chemistry and elemental distribution are important to understanding material identity, phase behavior, processing, or performance.
The technique is especially useful when bulk composition alone cannot explain local phase or inclusion chemistry. A combination of point measurements, WDS spectra, and elemental maps can provide complementary information from the same prepared region.
Mineral chemistry, phase comparison, inclusions, zoning, alteration, and geological microstructure.
Alloy composition, phases, precipitates, inclusions, segregation, and processing-related microchemistry.
Phase chemistry, elemental distribution, inclusions, interfaces, and composition variation.
Micro-volume elemental composition, layer chemistry, inclusions, and selected elemental maps.
EPMA planning depends on surface preparation, expected elements, standards, phase size, sample geometry, and whether point analysis or mapping is required.
Providing the intended measurement location and analytical objective early helps determine whether point composition, WDS spectra, elemental mapping, or a combination of outputs is appropriate.
Tell us the material, dimensions, polished-surface condition, expected elements, phase, and objective.
Our technical team reviews surface finish, sample geometry, phase size, and analysis requirements.
Discuss standards, elements, beam conditions, mapping area, step size, and requested outputs. The requested output can be defined around point composition, WDS spectra, elemental distribution, or a combination of these results.
Receive WDS spectra, quantitative composition, elemental maps, observations, and agreed documentation.
EPMA analysis is used for quantitative elemental composition, WDS spectra, elemental mapping, mineral chemistry, alloy-phase analysis, ceramics, geological materials, coatings, and suitable semiconductor samples.
EPMA may be suitable for polished minerals, metals, alloys, ceramics, glasses, geological materials, coatings, and other solid samples that can be prepared and analyzed under the required beam conditions.
WDS, or wavelength-dispersive spectroscopy, separates characteristic X-rays by wavelength. It supports elemental identification and quantitative composition from selected sample locations.
A flat, clean, polished surface helps maintain stable beam interaction and reliable X-ray measurement. Roughness, contamination, topography, porosity, or poorly exposed phases can affect data quality and interpretation.
Share the material, sample dimensions, polished-surface condition, expected elements, target phase or region, required quantitative accuracy, and whether you need point analysis, WDS spectra, or elemental mapping. Clear information about the region of interest also helps define the appropriate measurement route.
Share a few details for a technical review, or speak directly with our consultant by phone or WhatsApp.
Just a few details — our technical team will guide you.
Technical content reviewed by G-Hexa Technical Team.
Last reviewed: September 30, 2026